


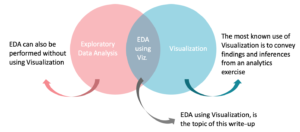
Exploratory Data Analysis (EDA) refers to the critical process of performing initial investigations on data so as to discover patterns, to spot anomalies,to test hypothesis and to check assumptions with the help of summary statistics and graphical representations. This phase of the project lies at the early stages, just after data is acquired.
On the other hand Data visualization is the graphical representation of information and data. By using visual elements like charts, graphs, and maps, data visualization tools provide an accessible way to see and understand trends, outliers, and patterns in data.
I am now specifically talking about EDA using visualisation.
EDA using visualisation can be to –
• Identify outliers
• Identify if the data requires transformations
• Do feature extraction
Here I am specifically discuss the use of visualisation for Feature extraction. The idea of feature extraction is done to enrich the data, this refers to adding and connecting data with other related information to provide deeper insights.
The starting point it is to understand data at most granular level ; that would mean, understanding the
• relationship between pairs of variables (Grade vs attendance) , called main effects and
• relationship within the variable (Grade vs attendance by a certain type of school), called interaction effects
Understanding these main effects and interaction effects can be a very tedious when the number of features in the data is extremely large. It might involve generating and going through hundreds of charts.
On this aspect, Tableau dashboards is a big boon. It allows you to create custom dashboards with all possible pairs of variables with all possible filters. This allows the researcher to create and understand the data through multidimensional and most granular level of within and between feature charts, all at one place.
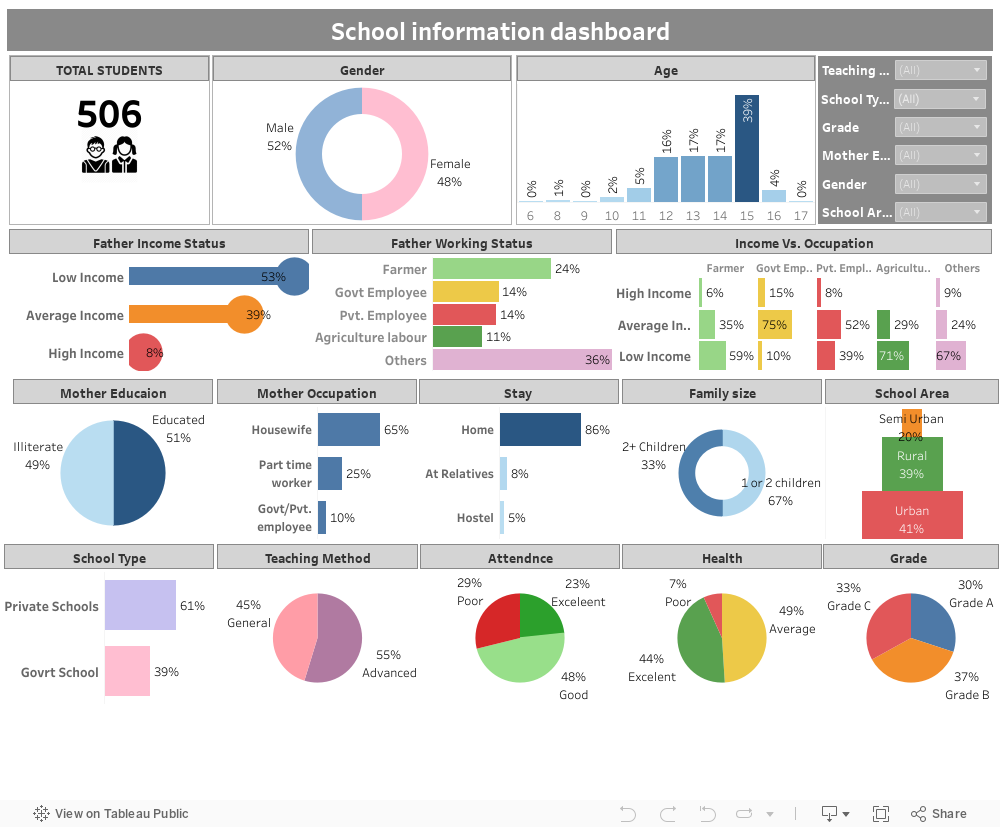
A case study – Understanding what affects the student grade through visualisation
This data set has the grade of the student with other possible influencing factors of the students of different schools in some districts of Andhra Pradesh and Telangana. There are around 30 data features in all.
X1= School Area, X2= Transport Facility, X3=Stationary Provided, X4=Play Ground is Available, X5= Number of Study hours, X6=Gender of the Student, X7= Winner of Competition? ( GK/Essay writing…), X8= Father Working Status, X9= Efficiency in Assignments, X10=Stay, X11=How do you come to school, X12=Tuition, X13=Care, X14=Mother Working Status, X15=Location, X16=Health and Physical Condition, X17=Teaching Methodologies, X18= Hygiene, X19=Attendance, X20=Type of School, X21=Number of Children in the Family, X22=Father Income Status, X23=Mother Education, X24=Ratio of Students per Teacher, X25=Class of the Student, X26=Age, X27=Ratio of Students and Teacher per class, X28=Number of Play Hours in Minutes, X29=Length of Study hours and X30=Distance. Dependent= Grade of the Student.
Now when I need to understand the relationship between these features Vs grade at an individual variable level as well combination of different variables (interaction), I do up a Tableau dashboard, and keep clicking on the various interactive filters depending on my hypotheses.. It allows me to as granular as I may want to.
Now when I need to understand the relationship between these features Vs grade at an individual variable level as well combination of different variables (interaction), I do up a Tableau dashboard, and keep clicking on the various interactive filters depending on my hypotheses.. It allows me to as granular as I may want to.
Level 1 – Grade Vs attendance
Level 2 – Grade Vs attendance in Private schools
Level 3 – Grade Vs attendance in private schools in a city
And so on…
>
Data exploration, particularly feature extraction is not humdrum anymore with Tableau Interactive dashboards!
