

NEED
In today’s fast-paced world, the need to grasp information quickly is more important than ever. With data becoming increasingly complex, having a clear visual representation can help make sense of it all. One powerful way to do this is by using mind maps. Mind maps are graphical tools that help organize and visualize information, making it easier to understand complex topics, see relationships between concepts, and retain knowledge. In this blog post, we’ll discuss why creating mind maps is beneficial for quickly understanding data, and demonstrate how to create a mind map using an example from the pharmaceutical industry.
Why Mind Maps?
Mind maps are beneficial for a variety of reasons:
Visual Representation: Mind maps allow for a visual representation of information, which makes it easier to comprehend large volumes of data.
Organization: They help organize thoughts and ideas in a hierarchical structure, allowing you to see the relationships between different pieces of information.
Retention: Studies have shown that visual learning enhances memory retention. Mind maps capitalize on this by turning abstract concepts into something more concrete.
Problem Solving: With the complex data we face today, mind maps are a helpful tool in problem-solving by breaking down the main problem into smaller, more manageable components.
Example: Creating a Mind Map from Real-World Data in Pharma
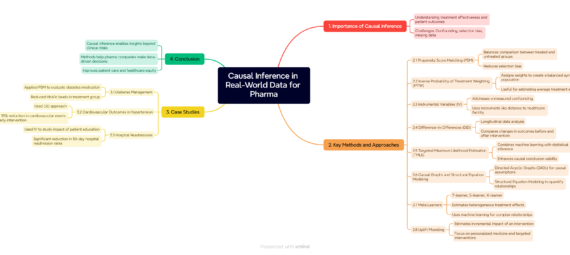
To illustrate how to create a mind map, let’s use an example from a document about causal inference in real-world data (RWD) for the pharmaceutical industry. The document discusses the importance of understanding treatment effectiveness and patient outcomes using data sources like electronic health records (EHRs) and insurance claims. This data presents opportunities to draw meaningful conclusions about treatment impact, but it comes with challenges like confounding, selection bias, and missing data.
lets summarize the content from this
in a simple Mindmap
Conclusion
Creating a mind map from a document allows for better, faster comprehension of data. Instead of slogging through long texts, you can visualize relationships and major points instantly. In the example we demonstrated here, creating a mind map of the key methods and approaches for causal inference in pharma makes it easy to understand the methodologies and their applications.
Mind maps aren’t just for the pharmaceutical industry—they can be applied to any domain where you need to make sense of large volumes of information. Start using mind maps today to boost your understanding and enhance your productivity.
Let me know if you found this guide helpful or if you need more insights on using mind maps for data analysis!
