Exploratory Data Analysis (EDA) is a crucial phase in any data science project, providing insights into the underlying patterns and relationships within your dataset. One powerful tool that can elevate your EDA experience is PyGWalker, a versatile Python library for interactive visualizations. In this blog post, we’ll explore the benefits of using PyGWalker for effective data exploration and provide code snippets along with visual outputs.
Why PyGWalker?
PyGWalker stands out for its ability to create visually appealing and interactive plots, making it easier to understand complex relationships in your data. With PyGWalker, you can create stunning 3D visualizations, interactive scatter plots, and more, bringing your data to life.
Benefits of PyGWalker in EDA:
- Interactivity:
- PyGWalker allows users to interact with plots in real-time, enabling dynamic exploration and analysis.
- Ease of Use:
- The library is designed with simplicity in mind, making it accessible for both beginners and experienced data scientists.
- Versatility:
- PyGWalker supports a wide range of plot types, from basic scatter plots to advanced 3D visualizations, providing flexibility in data representation.
- Aesthetics:
- The visualizations generated by PyGWalker are not only informative but also visually appealing, making them suitable for presentations and reports.
Getting Started with PyGWalker
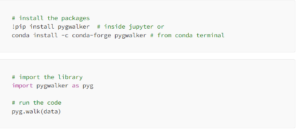
Installation:
To get started, install PyGWalker using the following pip command:
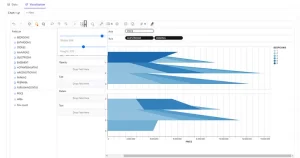
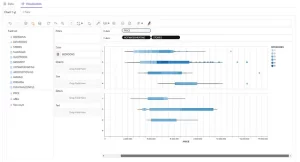
You will see an interactive interface after running the aforementioned code in Jupyter Notebook.
You can drag and drop the features into designated sections (whether it’s the x-axis or y-axis), enabling you to rapidly create plots and visually explore your data.