Introduction: Data Exploratory Analysis (EDA) is a crucial step in the data science pipeline that involves understanding and visualizing the characteristics of a dataset before diving into model building. Several Python packages have been developed to streamline and enhance the EDA process. In this blog post, we will explore four popular EDA packages – D-Tale, Sweetviz, PyCaret, and AutoViz, each offering unique features to facilitate a comprehensive exploration of your data
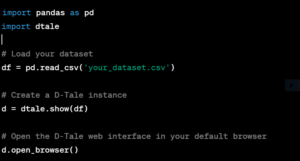
D-Tale: D-Tale is an interactive data visualization library that integrates seamlessly with Pandas dataframes, providing a user-friendly interface for exploring and analyzing data. Let’s take a look at how D-Tale simplifies the EDA process:
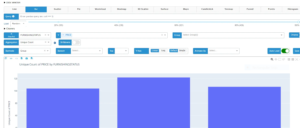
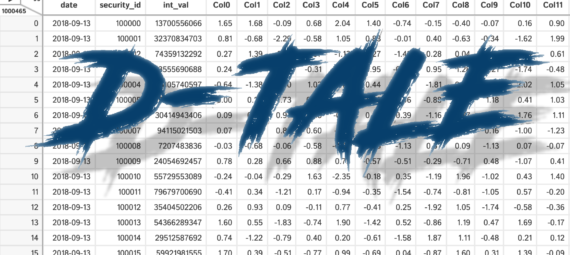
After running the above results will be displayed in your editor or browser like
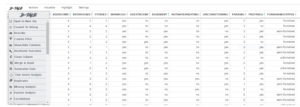
Explore the package outputs by simply navigating to any of the tabs located on the left side or at the top left corner of the above image. For instance, when you click the ‘Describe’ or ‘Correlation Analysis’ sections, you’ll be able to visualize the data distribution of each variable with a full description and the correlation matrix, respectively, as illustrated in the image below.”
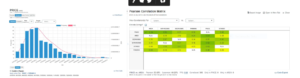
n the visualization section, It can also be used to plot lines, Pie charts, bars, scatter, and histograms. We can also group and aggregate the different features to visualize them