1)Spurious Correlations: A statistical correlation with no causal implication. This is basically when a statistical correlation doesn’t imply causality. Here is an example –

There is a huge correlation between the suicide rate and the amount of expenditure. But there is no causality.
2)The Simpson’s Paradox: Simpson’s Paradox refers to a situation where you believe you understand the direction of a relationship between two variables, but when you consider an additional variable, that direction appears to reverse.
Why does Simpson’s Paradox happen?
Simpson’s Paradox happens because disaggregation of the data (e.g., splitting it into subgroups) can cause certain subgroups to have an imbalanced representation compared to other subgroups. This might be due to the relationship between the variables, or simply due to the way that the data has been partitioned into subgroups.
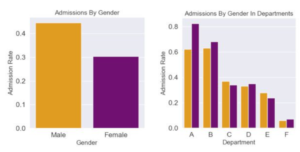
Example – Admissions
A famous example of Simpson’s Paradox appears in the admissions data for graduate school at UC Berkeley in 1973. In this example, when looking at the graduate admissions data overall, it appeared that men were more likely to be admitted than women (gender discrimination!), but when looking at the data for each department individually, men were less likely to be admitted than women in most of the departments.
3).Symmetry: Causality is inherently Asymmetric so applying symmetrical statistics will make a wrong inference. For example, Let’s say we represent the causal effect between the disease and the severity of a symptom in a linear equation.
Y = mX + b
Where
Y – Symptom Severity
X – Disease Severity
b – other factors
m – Correlation coefficient
The causal relationship between disease and severity of the symptom
This we have equal representation so If we apply linear algebra, we can represent X in terms of Y as follows.
X = ( Y – b ) / m
Inverted relationship between symptoms and diseases
Here’s the problem, if we interpret the first equation as diseases cause symptoms, then we have to interpret the second equation as symptoms cause diseases! Which is of course not true.
So if symmetry is a core property of algebra and statistics, we need a different formalism that can handle asymmetric relationships to represent causality.
Causality –
A variable, X, can be said to cause another variable Y, if when all confounders are adjusted, an intervention in X results in a change in Y, but an intervention in Y does not necessarily result in a change in X. This is in contrast to correlations, which are inherently symmetric i.e. if X correlates with Y, Y correlates with X, while if X causes Y, Y may not cause X.
In summary, X causes Y if when all confounders are adjusted, an intervention in X results in a change in Y, but intervention in Y doesn’t change X.