

Need: The test statistics such as χ2 and Fisher’s Exact Test only test whether there is a relationship between categorical variables or not but fail to provide the strength of the relationship.
Approach: To find the strength of relationship (such as correlation-like measures for numerical variables) between categorical variables we can use the Contingency Coefficient, the Phi coefficient or Cramer’s V. These coefficients can be thought of as Pearson product-moment correlations for categorical variables. However, unlike the Pearson r, which can assume negative values, these coefficients only range from 0 to +1 (you cannot have a ‘negative’ relationship between categorical variables)
How they will work
Essentially all these measures work χ2 and sample size (N)
The contingency coefficient (CC) is computed as follows:
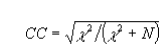
where χ2 = the Chi-square value and N = the sample size. Unfortunately, the maximum value of the contingency coefficient varies with table size (being larger for larger tables). For this reason, it is difficult to compare the association among variables among different size tables using this coefficient.
The Phi coefficient (φ) is a measure of nominal association applicable only to 2 x 2 contingency tables. It is calculated using the following formula
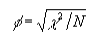
Ideally suits for contingency tables with 2 levels
Cramer’s V
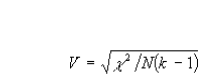
where N is the total number of cases and k is the lesser of the number of rows or columns.(in case of 2 levels both crammer’s and Phi will be the same)
Example
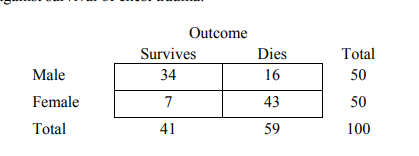
and the Chi square test results
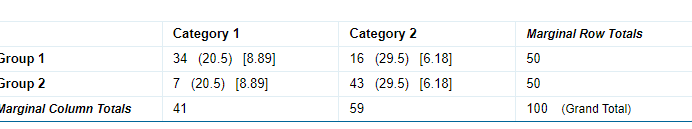
To determine whether or not the row and column categories for the table as a whole are independent of each other, i.e. we compute the Chi-square statistic (χ2 ):
The chi-square statistic is 30.1364. The p-value is < 0.00001. Significant at p < .05.
χ2 statistic exceeds the critical value, then we reject the null hypothesis and conclude that the variable categories are indeed related.
In order to find the strength of the association here we can use Phi or Cramer V in this case both are same and the value will be
In our example, the Phi coefficient = √30.14/50 = 0.60, a moderately strong association
When to Use χ2 and Fisher’s Exact Test(TIP)
If the minimum expected count for any cell in a contingency table is less than 5, then the resulting χ2 statistic may not be accurate. In this case, an alternative is needed. The alternative to the χ2 test for this situation is Fisher’s Exact Test. Most authors recommend using Fisher’s Exact Test statistics instead of χ2 whenever one or more of the expected counts in a table cell is less than 5 or when the row or column totals are very uneven.
http://vassarstats.net/index.html
