


Need: An outlier is a data point in a data set that is distant from all other observations. A data point that lies outside the overall distribution of the dataset. Outliers can drastically change the results of the data analysis and statistical modelling. There are numerous unfavorable impacts of outliers in the data set:
- It increases the error variance and reduces the power of statistical tests
- If the outliers are non-randomly distributed, they can decrease normality
- They can bias or influence estimates that may be of substantive interest
- They can also impact the basic assumption of Regression, ANOVA and other
Therefore, we need to detect these outliers before modeling and treat them properly
Approach:
There are 2 ways we can detect the outliers one based on the individual variable called uni-variate outlier detection and second one is detecting outliers based on more than one variables called multivariate outlier detection.
Univariate outlier detection methods
1)Standard Deviation Approach:
In statistics, If a data distribution is approximately normal then about 68% of the data values lie within one standard deviation of the mean and about 95% are within two standard deviations, and about 99.7% lie within three standard deviations.
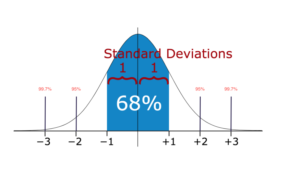
Therefore, if you have any data point that is more than 3 times the standard deviation, then those points are very likely to be anomalous or outliers.
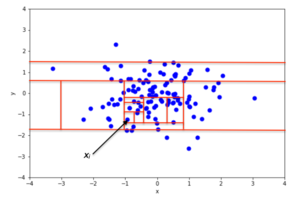
2)Boxplots:
Box plots are a graphical depiction of numerical data through their quantiles. It is a very simple but effective way to visualize outliers. Think about the lower and upper whiskers as the boundaries of the data distribution. Any data points that show above or below the whiskers, can be considered outliers or anomalous. Here is the code to plot a box plot:

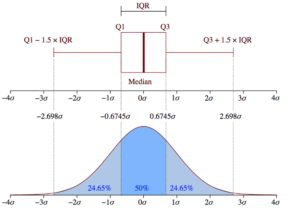
Boxplot Anatomy:
The concept of the Interquartile Range (IQR) is used to build the boxplot graphs. IQR is a concept in statistics that is used to measure the statistical dispersion and data variability by dividing the dataset into quartiles.
In simple words, any dataset or any set of observations is divided into four defined intervals based upon the values of the data and how they compare to the entire dataset. A quartile is what divides the data into three points and four intervals.
Interquartile Range (IQR) is important because it is used to define the outliers. It is the difference between the third quartile and the first quartile (IQR = Q3 -Q1). Outliers in this case are defined as the observations that are below (Q1 − 1.5x IQR) or boxplot lower whisker or above (Q3 + 1.5x IQR) or boxplot upper whisker
Multivariate outlier detection methods
DBScan Clustering:
Density-based spatial clustering of applications with noise(or, more simply, DBSCAN) is actually an unsupervised clustering algorithm, just like KMeans. However, one of its uses is also being able to detect outliers in data.
DBSCAN is popular because it can find non-linearly separable clusters, which can’t be done with KMeans and Gaussian Mixtures. It works well when clusters and dense enough, and are separated by low-density regions.

A high-level overview of how DBSCAN works
- The algorithm defines clusters as continuous regions of high density. The algorithm is quite simple:
- For each instance, it counts how many instances are located within a small distance ε (epsilon) from it. This region is called the instance’s ε- neighborhood.
- If the instance has more than min_samples instances located in its ε-neighborhood, then it is considered a core instance. This means that the instance is located in high density region(a region with many instances inside it.)
- All instances inside a core instance’s ε-neighborhood are assigned to the same cluster. This may include other core instances, therefore a single long sequence of neighboring core instances forms a single cluster.
- Any instances that are not a core instance, or are not located in any core instance’s ε-neighborhood are outliers
Isolation Forest
An Isolation Forest is an ensemble learning anomaly detection algorithm, that is especially useful at detecting outliers in high dimensional datasets. The algorithm basically does the following:
- It creates a Random Forest in which Decision Trees are grown randomly: at each node, features are picked randomly, and it picks a random threshold value to split the dataset into two.
- It continues to chop away the dataset until all instances end up being isolated from each other.
- An anomaly is usually far away from other instances, so, on average(across all Decision Trees), it becomes isolated in less steps that normal instances.
Local Outlier Factor
A simple approach to identifying outliers is to locate those examples that are far from the other examples in the feature space.
This can work well for feature spaces with low dimensionality (few features), although it can become less reliable as the number of features is increased, referred to as the curse of dimensionality.
The local outlier factor, or LOF for short, is a technique that attempts to harness the idea of nearest neighbors for outlier detection. Each example is assigned a scoring of how isolated or how likely it is to be outliers based on the size of its local neighborhood. Those examples with the largest score are more likely to be outliers.
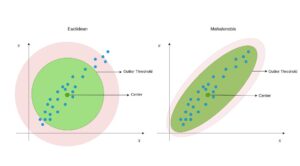
Mahalanobis Distance
Mahalanobis Distance (MD) is an effective distance metric that finds the distance between the point and distribution (see also). It works quite effectively on multivariate data because it uses a covariance matrix of variables to find the distance between data points and the center (see Formula 1). This means that MD detects outliers based on the distribution pattern of data points, unlike the Euclidean distance.
Other than these we will use one class classification techniques like (one class SVM) and Residual plots and Cooke distance for detecting outliers.
You will find the code for these methods in the below mentioned GitHub link
https://github.com/drstatsvenu/Outliers-detection
