


For businesses, while it is important to have an accurate model, an interpretable model is equally important. Since apart from wanting to know what our model’s prediction is, we also wonder why it is this high/low and which features are most important in determining the forecast. (Most machine learning algorithms produces variable importance as a part of their model. Model is evaluated using confusion matrix and there are different metrics like accuracy, precision, recall & F1 score. Each one gains prominence over the other depending on the business circumstance)
As in many real life problems providing a classification algorithm with good accuracy is not good enough, there is a need to indicate the action areas (prioritized!) where business are to focus. An example might be predicting customer churn — it is very nice to have a model that is successfully predicting which customers/employees are prone to churn, but identifying which variables are important can help us in early detection and maybe even improving the product/service!
Over the last 15 years of my working, I have been getting importance of variables using many methods right from stated methods (rating, ranking…etc) to derived methods like regression; lately we have been using machine learning methods like decision trees, neural networks, random forest…etc. Many a times, I have used trade off utilities (max diff scores/ conjoint) as well for ‘importance’.
Irrespective of how I get the variable importance, for making these findings actionable, I like to go back to this very old and commonly used approach – Importance performance plots. You adding another dimension here which is ‘performance’. A simple 2 by 2 with 4 quadrants (as illustrated below)
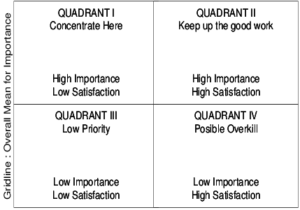
This quadrant plot will visually show marketers where they should focus their efforts, plan their marketing activities.Also, you would fix ‘poor’ performance, back off if your performance was ‘overkill’, and could ignore low priority elements.
A case study
Objective:
One of the leading shampoo brands wanted to ascertain what is driving brand satisfaction, what the present gaps are , thereby what the future action plan should be (In terms of marketing activities and positioning)
Approach:
We applied the supervised machine learning algorithms by considering ‘overall satisfaction’ as a dependent with various imagery attributes as independent variables and derived importance score.
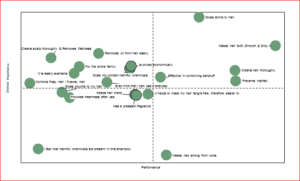
IMPACT – This plot clearly gave the client an action plan not only interns of newer areas to focus on but also areas to de-focus on.
