

Need
Cluster analysis is widely adopted by various applications like image processing, neuroscience, economics, network communication, medicine, recommendation systems, customer segmentation, to name a few. Additionally, clustering can be considered the initial step when dealing with a new dataset to extract insights and understand the data distribution.
How it will work
Cluster analysis, clustering, or data segmentation can be defined as an unsupervised (unlabelled data) machine learning technique that aims to find patterns (e.g., many sub-groups, size of each group, common characteristics, data cohesion…)
Types of Clustering
1 ) Centroid-based clustering
k-means or Lloyd’s algorithm
One of the most popular partitioning algorithms (with over a million citations on google scholar) used to cluster numerical data attributes. Using this polythetic hard clustering technique, n data objects are split into k partitions (k << n) where each partition represents a cluster. Each cluster must contain at least one data point. Additionally, each data object must belong to one group only. Further, observations of the same cluster should be similar or closed to each other. In contrast, objects of different groups must far apart or dissimilar from each other. In other terms, the goal of the k-means algorithm is to maximize the distance between each pair of clusters’ centers and minimize the distance between observations within each cluster (e.g., minimize the sum of squared error, SSE, within a cluster.).

Advantages
- The learning curve is relatively steep.
- Fast convergence for clustering small datasets
- Easy to implement
Drawbacks
- Computationally expensive for large datasets(k becomes large.).
- Sometimes, it is difficult to choose an initial value for the number of clusters(k).
- Strong sensitivity to outliers.
k-medoids, PAM(Partitioning Around Medoids)
A modified version of the k-means algorithm where a medoid represents a data point with the lowest average dissimilarity among all points within a cluster. The purpose is to minimize the overall cost for each cluster. Unlike k-means, it uses a medoid as a metric to reassign the centroid of each cluster. Medoids are less sensitive to outliers. These medoids are actual observations from the dataset and not computed points(mean value) like in the case of k-means. It is preferred to use the manhattan distance as a metric because it is less sensitive to outliers.’
k-Modes/Median
Since K-means handles only numerical data attributes, a modified version of the k-means algorithm has been developed to cluster categorical data. The mode replaces the mean in each cluster. However, someone could come with the idea of mapping between categorical and numerical attributes and then clustering using k-means. This could sometimes work on a small dimensional dataset
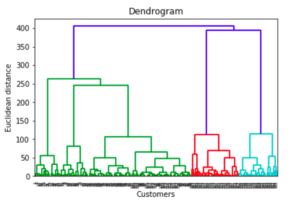
Hierarchical clustering: Hierarchical clustering works in two different ways: the first one is called a “bottom-up” or agglomerative clustering, where each observation gets its own cluster, then each pair of clusters are merged together to form another cluster, and so on. The other one (a.k.a. “top-down” or divisive clustering) works in the opposite direction, i.e., all observations start with one cluster, then repeatedly divided into smaller cluster sizes.
Advantages:
- Easy to implement; number of clusters is easy to identify by looking at the dendrogram;
- More informative than K-means clustering
Disadvantages:
- Highly sensitive to outliers;
- Can be time consuming for large datasets
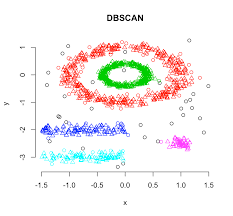
Density-based spatial clustering (DBSCAN)
DBSCAN groups together points that are closely packed together while marking others as outliers which lie alone in low-density regions. There are two key parameters in the model needed to define ‘density’: minimum number of points required to form a dense region min_samples and distance to define a neighborhood eps. Higher min_samples or lower eps demands greater density to form a cluster
Based on these parameters, DBSCAN starts with an arbitrary point x and identifies points that are within neighbourhood of x based on eps and classifies x as one of the following:
- Core point: If the number of points in the neighbourhood is at least equal to the min_samplesparameter then it called a core point and a cluster is formed around x.
- Border point: x is considered a border point if it is part of a cluster with a different core point but number of points in it’s neighbourhood is less than the min_samples parameter. Intuitively, these points are on the fringes of a cluster
- Outlier or noise: If x is not a core point and distance from any core sample is at least equal to or greater thaneps , it is considered an outlier or noise
For tuning the parameters of the model, we first identify the optimal eps value by finding the distance among a point’s neighbors and plotting the minimum distance. This gives us the elbow curve to find density of the data points and optimal eps value can be found at the inflection point. We use the NearestNeighbours function to get the minimum distance and the KneeLocator function to identify the inflection point
OPTICS: Ordering Points To Identify Clustering Structure.
Since the performance of DBSCAN depends on its parameters setup, Optics has extended DBSCAN, makes it less sensitive to parameter setting, and finding structures among clusters. The intuition is that higher density regions will be processed first before the lower ones based on two parameters:
- Core distance: The smallest radius eps that contains at least MinPts observations.
- Reachability distance: The minimum distance that makes two observations density-reachable from each other
Model/Distribution-based clustering.(GMM)
Gaussian Mixture Models (GMMs), can be viewed as an extension of the ideas behind k-means. GMM attempts to model the given data as a mixture of multiple multi-dimensional Gaussian probability distributions.
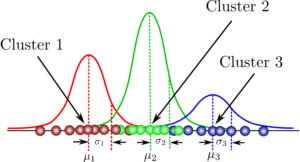
It works on the basis of the Expectation-Maximization (E-M) algorithm and handles the probabilistic nature of the generated data intrinsically.
In the simplest case, GMMs can be used for finding clusters in the same manner as the k-means. However, it performs flawlessly for non-circular data blobs because it can tailor the individual Gaussian distributions with parameters (std. dev and mean) suitable to fit the particular shape of the data
BIRCH is Balanced Iterative Reducing Clusters using Hierarchies:

This algorithm is used to perform hierarchical clustering based on trees. These trees are called CFT i.e. Cluster Feature Trees. The full form of BIRCH is Balanced Iterative Reducing Clusters using Hierarchies. The use case of BIRCH clustering is in below scenario:
- Large dataset
- Outlier detection
- Data reduction
The metric use in this cluster to measure the distance is Euclidean distance measurement.
Advantages
There are some points that BIRCH is very useful in clustering algorithms as shown below:
- It is very useful to handle noise in the data set.
- It is useful to find the good quality of clusters and sub-clusters.
- It is memory efficient to require less scanning process of the data set to reduce the cost of the I/O cost.
- It is far better than the DBSCAN clustering algorithm.
Disadvantages
Every algorithm has advantages but also have disadvantages to make the researchers study further as shown below:
- The numerical issue with the distance calculation with SS value to get poor precision.
Self Organization Maps
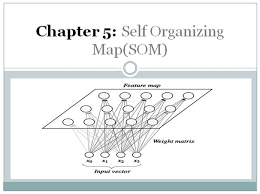
- The Self Organizing Map is one of the most popular neural models. It belongs to the category of the competitive learning network. The SOM is based on unsupervised learning, which means that is no human intervention is needed during the training and those little needs to be known about characterized by the input data. We could, for example, use the SOM for clustering membership of the input data. The SOM can be used to detect features inherent to the problem and thus has also been called SOFM the Self Origination Feature Map.
- The Self Organized Map was developed by professor kohenen which is used in many applications.
- The purpose of SOM is that it’s providing a data visualization technique that helps to understand high dimensional data by reducing the dimension of data to map. SOM also represents the clustering concept by grouping similar data together.
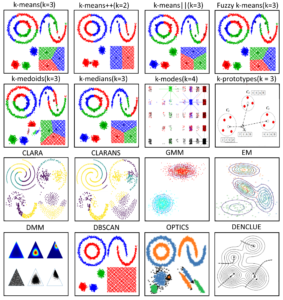
Comparison of the algorithms

Source:
https://medium.com/machine-learning-researcher/self-organizing-map-som-c296561e2117
https://pub.towardsai.net/fully-explained-birch-clustering-for-outliers-with-python-2ad6243f126b
