


Need
The number of input variables or features for a dataset is referred to as its dimensionality. Dimensionality reduction refers to techniques that reduce the number of input variables in a dataset. More input features often make a predictive modeling task more challenging to model, more generally referred to as the curse of dimensionality.
Why is Dimensionality Reduction required?
Here are some of the benefits of applying dimensionality reduction to a dataset:
- Space required to store the data is reduced as the number of dimensions comes down Less dimensions lead to less computation/training time
- Some algorithms do not perform well when we have a large dimensions. So reducing these dimensions needs to happen for the algorithm to be useful It takes care of multicollinearity by removing redundant features
- with small features the model is easy to apply and easy to understand
Common Dimensionality Reduction Techniques
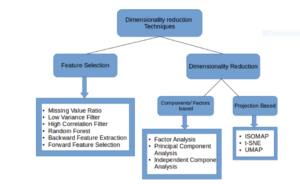
Missing Value Ratio: If the dataset has too many missing values, we use this approach to reduce the number of variables. We can drop the variables having a large number of missing values in them
Low Variance filter: We apply this approach to identify and drop constant variables from the dataset. The target variable is not unduly affected by variables with low variance, and hence these variables can be safely dropped
High Correlation filter: A pair of variables having high correlation increases multicollinearity in the dataset. So, we can use this technique to find highly correlated features and drop them accordingly
Random Forest: This is one of the most commonly used techniques which tells us the importance of each feature present in the dataset. We can find the importance of each feature and keep the top most features, resulting in dimensionality reduction
Both Backward Feature Elimination and Forward Feature Selection techniques take a lot of computational time and are thus generally used on smaller datasets
Factor Analysis: This technique is best suited for situations where we have highly correlated set of variables. It divides the variables based on their correlation into different groups, and represents each group with a factor
Principal Component Analysis: This is one of the most widely used techniques for dealing with linear data. It divides the data into a set of components which try to explain as much variance as possible
Independent Component Analysis: We can use ICA to transform the data into independent components which describe the data using less number of components
ISOMAP: We use this technique when the data is strongly non-linear
t-SNE: This technique also works well when the data is strongly non-linear. It works extremely well for visualizations as well
UMAP: This technique works well for high dimensional data. Its run-time is shorter as compared to t-SNE
