


OBJECTIVE
Getting the price of a product right is one of the most challenging issues faced by a B2B marketer. Price Sensitivity Measurement (PSM) Analysis is one of the marketing techniques for determining consumer price preferences by assessing different price-levels to provide recommendation on the most optimal price of a product. The aim of the research was to determine the Optimum-Price-Point (OPP) that supports the quality of a brand by differentiating the OPP for the common sample in optimal prices as assessed by consumers.
APPROACH
A traditional PSM exercise includes a series of unaided pricing questions for the product under study and generally, take the following form:
- At what price do you consider ‘Product X’ to be a bargain? (a great deal for the money)
- At what price do you consider ‘Product X’ to start getting expensive but still worth considering? (expensive/on the higher side)
- At what price do you consider ‘Product X’ to be too expensive and would not even consider it? (too expensive)
- At what price do you consider ‘Product X’ to be too cheap that you would doubt its quality? (too cheap)
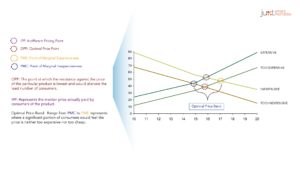
The four questions which have been presented above will yield four cumulative distributions. Please note that the standard method requires that two of the four cumulative frequencies must be inverted when plotted in order to have the possibility of four intersecting points. Finally, the intersection of the “too cheap” and “too expensive” lines represents an “optimal price point”. This is the point at which an equal number of respondents describe the price as exceeding either their upper or lower limits.
The other intersecting points are:
PMC=Point of Marginal Cheapness: The price point where more sales would be lost because of the questionable quality than gained from those seeking a bargain (intersection of “too cheap” and “expensive”) and is the lower bound of an acceptable price range.
PME=Point of Marginal Expensiveness: The price point above which the cost of the product outweighs the perceived value derived from it (intersection of the “too expensive” and “cheap”) and is the upper bound of an acceptable price range.
OUTCOME
PSM claims to capture the extent to which a product has an inherent value denoted by price. The implications of the study suggest that the price should be set in accordance to the opinion of the consumers that incorporates their estimation of the brand value into their optimal price which is based on the data that was analysed to obtain Optimal Price Band (OPB). From the PSM graphs, one can get useful information about the price-reductions one has to offer to make a “psychological impression” on the consumers.
