


Objective
The largescale baseline exercise is conducted to gain an
- In-depth understanding of ‘party perception’ – Perceptual strength & weakness of a party vis-à-vis others
- In-depth understanding of ‘leader perception’ – Perceptual strength & weakness of a leader vis-à-vis others
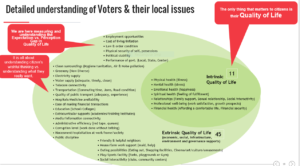
- In-depth understanding the local issues – An in-depth understanding of extrinsic local issues highlighted by the voters
Understanding the various segments of voters by
- Geography (urban vs. rural, town class, village class)
- Demography (age, gender, education, occupation, family size, stage of life cycle)
- Socio-economic back ground (social-class, affluence level, caste, religion, income class/affluence)
- Party & candidate affiliation(doesn’t support but vote, supports but does not vote, floating voter, influencing voter and core voter)
- By kind of voters (non interested voters, interested to participate but don’t give vote, disgusted hostile voter, those who vote)
Sampling Methodology
Sample collection at granular level – We will collect the sample at ward level within ACs
Source of Sample
- Intercepts with a particular ward
- A self filling q’re on a tab / the survey link will be whatsapped to the respondent to be filled in then and there.
In addition, also use of chatbots and QR code based survey.
Sampling Sizes and Quotas
- We propose to cover 20 key constituencies (2000 sample at the AC level – 40,000 sample in all)
- The polling booths will be randomly selected
- We do not recommend quota sampling. Our objective is to explore and understand :: for that the sample needs to be representative and hence random. We will however ensure demographic checks and geographic distribution within constituency.
- We will continue with data collection till we get a 75 sample at the AC level for the groups (doesn’t support but vote, supports but does not vote, floating voter, ..etc.) at a party level for 3 parties.
- The natural spread should give us good sample for the voter groups.

Deliverable
Tabs in excel by the various cuts mentioned earlier
Report in PPT format
Tableau report – linked to past election results and other datasets

Large Scale Quantitative Exercise of party/ candidate