

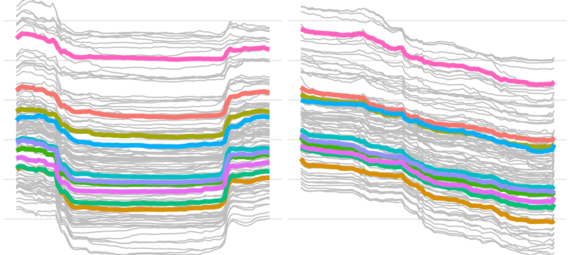
Partial dependence plots (PDP) are a type of model-agnostic XAI technique that allows us to visualize the relationship between an input feature and the model’s output. PDPs show how the predicted outcome changes as we vary the values of a single input feature while holding all other features constant.
To create a PDP, we start by selecting the feature of interest and defining a range of values that we want to explore. We then generate a set of synthetic input samples by varying the feature of interest while keeping all other features constant. For each sample, we record the model’s prediction. Finally, we plot the average predicted outcome for each value of the feature of interest.
PDPs can be helpful in several ways:
Understanding feature importance: PDPs can help us identify which input features have the most significant impact on the model’s output. Features that result in large changes in the predicted outcome are considered more important.
Visualizing non-linearities: PDPs can reveal non-linear relationships between the input feature and the model’s output. For example, a feature may have a positive effect on the output up to a certain point, after which the effect becomes negative.
Detecting interactions: PDPs can help us detect interactions between input features that affect the model’s output. For example, the effect of one feature on the output may depend on the value of another feature.
Validating the model: PDPs can help us validate the model’s behavior by comparing the predicted outcomes to our prior knowledge of the task at hand. If the PDPs are consistent with our expectations, it can increase our trust in the model’s predictions.
Overall, PDPs provide an intuitive and interpretable way to understand how a model is making its predictions and can help us identify areas for improvement or further investigation.
To calculate a partial dependence plot (PDP), we need to follow these steps:
- Select the feature of interest: Choose the feature that we want to explore and understand its relationship with the model’s output.
- Define the range of values: Define a range of values for the feature of interest that we want to explore. For example, if the feature of interest is age, we might want to explore ages from 20 to 80.
- Generate synthetic input samples: Generate a set of synthetic input samples by varying the feature of interest while holding all other features constant. We can do this by creating a grid of values for the feature of interest and fixing the values of all other features to a constant value, such as the median or mean value.
- Predict the outcome: For each synthetic input sample, we pass it through the model and record the model’s predicted output.
- Calculate the average predicted outcome: For each value of the feature of interest, calculate the average predicted outcome across all synthetic input samples that have that value for the feature of interest.
- Plot the PDP: Finally, plot the feature values on the x-axis and the average predicted outcome on the y-axis to create the PDP.
The resulting PDP shows how the model’s predicted outcome changes as we vary the feature of interest while holding all other features constant. It provides insights into the relationship between the feature of interest and the model’s output, such as whether the relationship is linear or non-linear, and whether there are any interactions between the feature of interest and other features.
PDPs are a powerful tool for understanding how a model is making its predictions, and they can help us identify which features are most important for the model’s performance.
