

SHAP (SHapley Additive explanations) is another popular method for explaining the predictions of machine learning models. In this blog post, we will explore the SHAP technique, how it works, and its application in healthcare using a use case.
What is SHAP?
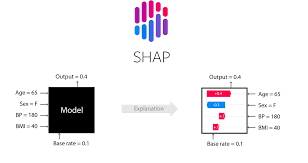
SHAP is a method for explaining the predictions of machine learning models. It works by computing the contribution of each feature to the prediction, based on the concept of Shapley values from cooperative game theory. The method is called “additive” because it decomposes the prediction into the sum of the contributions of each feature.
SHAP values have several desirable properties, including consistency, efficiency, and accuracy. They also provide a unified framework for interpreting the output of any machine learning model, including complex models like neural networks and ensemble models.
How SHAP works
The SHAP method can be divided into three main steps:
Computing feature importance scores: This step involves computing a feature importance score for each feature in the dataset. The score is computed based on the impact of each feature on the model’s predictions.
Computing Shapley values: In this step, the SHAP method computes the Shapley value for each feature, which represents the average marginal contribution of the feature across all possible feature combinations. The Shapley value is computed using a weighted average of the feature importance scores, where the weights are given by the number of feature combinations that include each feature.
Explaining individual predictions: In this step, the SHAP method generates an explanation for each individual prediction by computing the contribution of each feature to the prediction using the Shapley values.
SHAP Use Case: Predicting Heart Disease
To demonstrate the SHAP technique in healthcare, we will use a dataset of patients with heart disease. The dataset contains information such as age, gender, cholesterol levels, and blood pressure, as well as a binary label indicating whether the patient has heart disease.
Our goal is to build a model that can predict whether a patient has heart disease based on their medical history. We will use a gradient boosting model for this task, as it is a common and effective method for binary classification tasks.
After training the gradient boosting model, we can use SHAP to explain the model’s predictions for a specific patient. For example, let’s consider a patient who is 55 years old, male, with cholesterol levels of 230 and a blood pressure of 140/90. The gradient boosting model predicts that this patient has a high risk of having heart disease.
Using SHAP, we can compute the contribution of each feature to the model’s prediction for this patient. The SHAP visualization shows that age and cholesterol levels are the most important factors for predicting heart disease for this patient. Specifically, the visualization shows that high levels of cholesterol increase the risk of heart disease, while older age also increases the risk.

Conclusion
SHAP is a powerful method for explaining the predictions of machine learning models, especially black-box models. By computing the contribution of each feature using Shapley values, SHAP provides a way to understand the importance of each input feature for a specific prediction. In healthcare, SHAP can be used to identify the factors that increase the risk of certain diseases, allowing healthcare professionals to provide personalized treatments and interventions to improve patient outcomes.
