

Objective
Propensity score methods allow investigators to estimate causal treatment effects for observational or nonrandomized data.
Need:
In most of the classical experiments either in healthcare or market research studies covariates (features) are balanced through randomization so that treated and untreated groups have the same rate of occurrence . Whereas, in case of observational studies (data from EHR’s) or some of the A/B testing studies this is not the case where the effects of treatments and covariates are confounded and hence running the standard statistical analysis and interpretation is always dubious
Approach
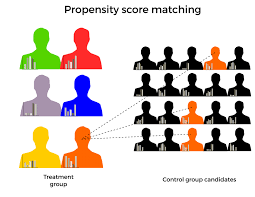
Propensity scores are an alternative method to estimate the effect of receiving treatment when random assignment of treatments to subjects is not feasible. PSM refers to the pairing of treatment and control units with similar values on the propensity score; and possibly other covariates (the characteristics of participants); and the discarding of all unmatched units.
How it will work
A balancing score is any function of the set of covariates that captures all the information of the set that is dependent on treatment. Such a balancing score would allow us to model the relation between the confounders and treatment in a relatively simple way. And the minimal expression of a balancing score is the propensity score
In the statistical prospective, below are the steps
- Estimate the propensity score. This is the probability (logistic regression) that an observation is treated or not. Then convert it to its logit value.
- Perform matching. For each treated sample, identify an untreated sample with similar logit propensity score. The matching is 1-to-1 with replacement.
- In cases where we do not have enough untreated elements, then the same one can be re-used. The matching takes place using the treated elements as source.
- Once matching is performed, we review the balance of the X variables to assess their balance.
- Estimate the impact of treatment.
Case study
Example to compute the Average Treatment Effect (ATE) from observational datasets with Treatment and Mortality rate.
ATE = Average mortality rate of treated (16.5) – Average mortality rate of untreated (12.4) is 4.1
Which means mortality rate will increase 4.1 if we decide to treat everybody.
This result would then counsel us that we should not treat our population, but our common sense may be “tingling” and making us wonder if that is really the case. And rightly so, because we overlooked a tiny but very crucial details, and that is that the treatment is not distributed equally between covariates. In other words, treatment is not randomized, and hence, this way of calculating the ATE is simply not correct.
| Treatment | Mortality Rate | Poverty Rate | Per Capita Doc | Probability |
| 1 | 10 | 0.5 | 0.01 | 0.41657 |
| 1 | 15 | 0.6 | 0.02 | 0.73582 |
| 1 | 22 | 0.7 | 0.01 | 0.92845 |
| 1 | 19 | 0.6 | 0.02 | 0.73582 |
| 0 | 25 | 0.6 | 0.01 | 0.75271 |
| 0 | 19 | 0.5 | 0.02 | 0.39516 |
| 0 | 4 | 0.1 | 0.04 | 0.00165 |
| 0 | 8 | 0.3 | 0.05 | 0.0268 |
| 0 | 6 | 0.2 | 0.04 | 0.00701 |
The propensity score is estimated using a logistic regression model, in which treatment status is regressed on observed baseline characteristics. The estimated propensity score is the predicted probability of treatment derived from the fitted regression model.
To remove the effects of confounding when estimating the effects of treatment on outcomes, we used propensity score matching. And a new sample of data is simulated in which the covariates occur equally among treated and untreated groups. Although the new simulated sample changes which patients are part of the sample, it does not change the true relationship between treatment and outcome.
With this new sample we got the ATE as -7 i.e., 16.5 – 23.5
Mortality rate will decrease by 7 if we decide to treat everybody
