


Need: Missing data is a common and exciting problem in statistical analysis and machine learning hence we need to understand the cause of the missingness (pattern) and need to impute properly otherwise the random imputation might effect the solution /interpretation of the analysis.
Therefore, identifying the pattern of missing is very crucial.
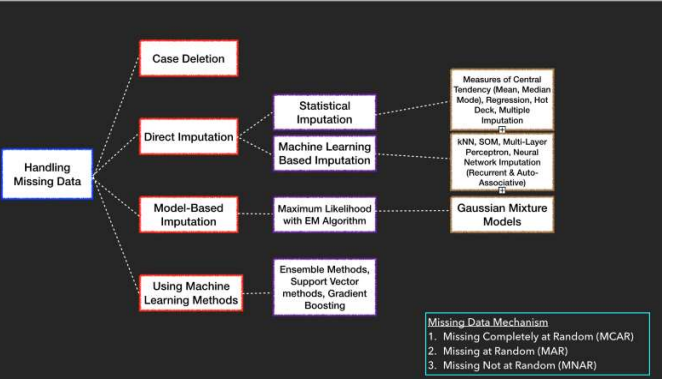
There are mainly three types of missing values out there.
- Missing Completely At Random(MCAR):A variable is missing completely at random if the probability of being missing is the same for all the observations when data is MCAR, which Means there is absolutely no relationship between the data missing and any other observed or missing value in the dataset. In other words, those missing data points are a random subset of the dataset.
- Missing Data Not At Random (MNAR): As the name suggests there will some relationship between the data missing and any other value in the dataset.
- Missing At Random (MAR): It means that the propensity for the data point to be missed is not related to the missing data but it is related to some other observed data in the dataset.( Like obese people doesn’t want to mentioned there weight)
Why do we need to find the pattern of missing?
In order to impute the missing values as a first step we need to find what type of missing value it is (MCAR, MNAR, MAR). Based on the type of missing value we have different methods of imputations are exists in the literature, for example if your Missing type is (MCAR/MNAR) most of the times that missing values were imputed by average/median if it is continuous, Mode in case of categorical variables. But in case of MAR we have different kind of predictive and multiple imputation methods.
Hence identifying missing pattern is very important
Identifying the pattern of missing
In order to find the pattern of the missing values we need check the correlations as well as co cooccurrences of missing values for different variables by some kinds of nullity matrix, heatmaps/bar charts and correlation plots
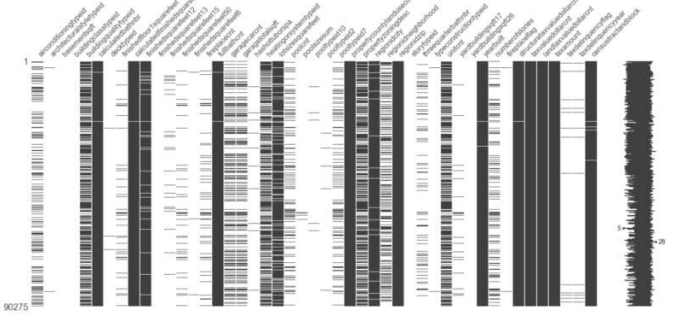
The nullity matrix gives you a data-dense display which lets you quickly visually pick out the missing data patterns in the dataset. Also, the sparkline on the right gives you a summary of the general shape of the data completeness and an indicator of the rows with maximum and minimum rows.
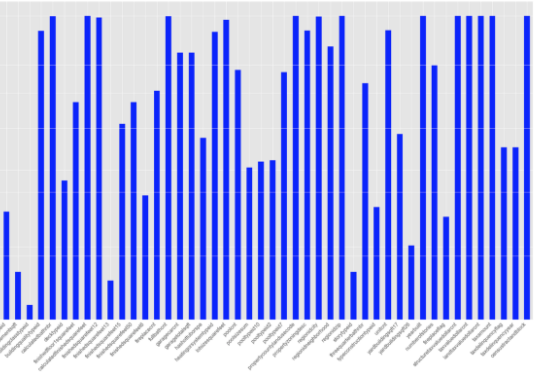
The same above information will also viewed by Bar charts by
log transform the data on the y-axis to better visualize features with very large missing values.
Or Finally a simple correlation heatmap is shown below. This map describes the degree of nullity relationship between the different features. The range of this nullity correlation is from -1 to 1 (-1 ≤ R ≤ 1). Features with no missing value are excluded in the heatmap. If the nullity correlation is very close to zero (-0.05 < R < 0.05), no value will be displayed. Also, a perfect positive nullity correlation (R=1) indicates when the first feature and the second feature both have corresponding missing values while a perfect negative nullity correlation (R=-1) means that one of the features is missing and the second is not missing.

By examining these 3 charts, we can conclude that whether there is any correlation between missing values or not, if there is a correlation exits then we conclude that the Missing values falls under (Missing at Random- MAR) and need to use respective imputation methods such as predictive based, or multiple imputation. If there is no correlation exists then we can conclude that missing fall under (MCAR, MNAR) then we can use either delate options (like case wise/list wise if we have enough data) if not we will use average/median imputation for continuous or mode for categorical variables.
The all-possible methods listed in the below diagram on the basis of its pattern/ Type of missing
https://github.com/drstatsvenu/Missing-pattern/blob/main/Mice%20in%20python.ipynb
