


Need: While choosing the suitable test statistics for hypothesis testing one of the key factors is data distribution. If the data distribution is normal distribution then we will apply the parametric tests such as t, Anova, f—etc., if data is not following normal distribution then either we can apply the non-parametric tests such as sign test, Wilcoxon tests …etc. , or we can transform the non-normal distribution into normal distribution and then apply parametric test on transformed variable. Therefore, testing whether data /distribution follows normal distribution or not is one of the important things in inferential statistics
Approach: There are some visualization as well statistical tests exists in the literature in order to find whether distribution follows normal distribution or not.
Visualization Methods
Histogram/Density plots: histogram/Density plots are a data visualization that shows the distribution of a variable. It gives us the frequency of occurrence per value in the dataset, which is what distributions are about.

Box plot:
The Box Plot is another visualization technique that can be used for detecting non-normal samples. The Box Plot plots the 5-number summary of a variable: minimum, first quartile, median, third quartile and maximum.

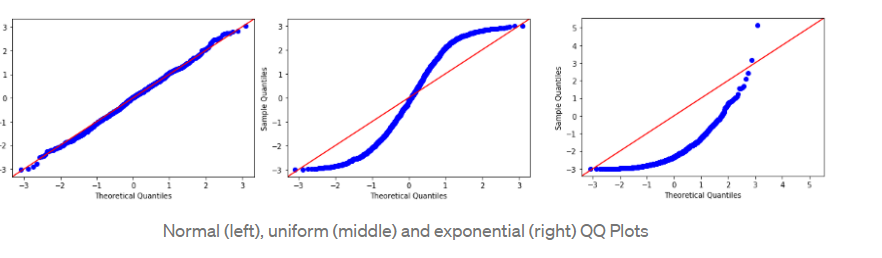
QQ Plot
QQ Plot stands for Quantile vs Quantile Plot, which is exactly what it does: plotting theoretical quantiles against the actual quantiles of our variable
The QQ Plot allows us to see deviation of a normal distribution much better than in a Histogram or Box Plot.
Statistical tests
Kolmogorov Smirnov test
This is a non-parametric test i.e.; it has no assumption about the distribution of the data. Kolmogorov-Smirnov test is used to understand how well the distribution of sample data conforms to some theoretical distribution. In this, we compare between some theoretical cumulative distribution function, (Ft(x)), and a samples’ cumulative distribution function, (Fs(x)) where the sample is a random sample with unknown cumulative distribution function Fs(x).
The Test Statistic of the KS Test is the Kolmogorov Smirnov Statistic, which follows a Kolmogorov distribution if the null hypothesis is true.
If the observed data perfectly follow a normal distribution, the value of the KS statistic will be 0. The P-Value is used to decide whether the difference is large enough to reject the null hypothesis:
- If the P-Value of the KS Test is larger than 0.05, we assume a normal distribution
- If the P-Value of the KS Test is smaller than 0.05, we do not assume a normal distribution
It is also sensitive to outliers. On the other hand, it can be used for other types of distributions.
Shapiro Wilk test
The Shapiro Wilk test is the most powerful test when testing for a normal distribution. It has been developed specifically for the normal distribution and it cannot be used for testing against other distributions like for example the KS test.
- If the P-Value of the Shapiro Wilk Test is larger than 0.05, we assume a normal distribution
- If the P-Value of the Shapiro Wilk Test is smaller than 0.05, we do not assume a normal distribution
Anderson-Darling test (This test if sample is coming from a particular distribution. The null hypothesis is that the sample is drawn from a population following a particular distribution. For the Anderson-Darling test, the critical values depend on the distribution it is being tested. The distribution it takes are normal, exponential, logistic, or Gumbel (Extreme Value Type I) distributions. If the test statistic is larger than the critical value then for the corresponding significance level, the null hypothesis (i.e., the data come from the chosen distribution) can be rejected. Precisely, the hypotheses for the AD-test are:
H0: The data comes from a particular distribution.
HA: The data does not come from a particular distribution.
Which approach to use!
For quick and visual identification of a normal distribution, use a QQ plot if you have only one variable to look at and a Box Plot if you have many. Use a histogram if you need to present your results to a non-statistical public.
As a statistical test to confirm your hypothesis, use the Shapiro Wilk test. It is the most powerful test, which should be the decisive argument.
Source/Code: https://github.com/salonimishr/Methods-for-Normality-Tests/blob/main/Methods%20for%20Normality%20Tests.ipynb
https://towardsdatascience.com/methods-for-normality-test-with-application-in-python-bb91b49ed0f5
