How does it help
For Assembly Constituency (AC) / booth level intelligence and action.
- develop electoral maps
- deep dive on a candidate or compare candidates
- deep dive on party performance
- analyze voter base / voting patterns in past election
Source of data ( a few mentions)
- ceodelhi.gov.in
- eci.nic.in
- oneindia.com
- infoelections.com
- elections.in
- data.gov.in
- myneta.com
- census2011.co.in
Methodology
The relevant data is extracted from the above mentioned sources, then follows the next step of cleansing and transforming data into the appropriate format for dashboard
Metrics
We have developed multiple metrics that help in assessment, evaluation and comparison of ACs/ parties/ Candidates. For e
- AC level metrics – Anti-Incumbency Score
- Candidate metrics – Win Margin Score,
- Party Metrics – Party Dominance Score , Party Win Probability

Deliverable
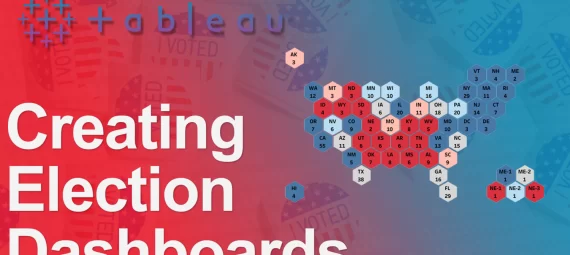
The deliverable is a set dashboards on Tableau online. One can interactively look at the visualisations. Tableau online is an analytics platform fully hosted on the cloud. The user is provided with user credentials for access. These are totally custom made and hence can be designed as per requirement.


